

Image to Spreadsheet — Data extraction, Data cleaning, and Data validation


Photo by Lukas Blazek on Unsplash
Greetings to all!
As part of my current project, I am planning to extract data from images and put it into a spreadsheet. I will walk you through all the steps I will take.
Files related to the project can be accessed from the GitHub link.
Problem statement
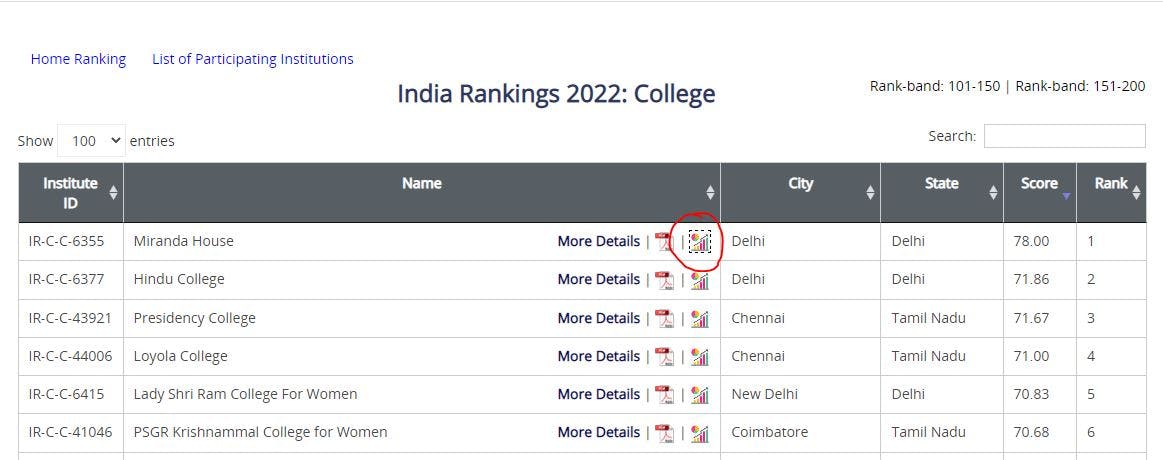
For all colleges, we need to extract the NIRF ranking data. Currently, each college's data is stored individually in image format (.png). This data needs to be extracted and put into a spreadsheet.
Data Extraction
Understand your data
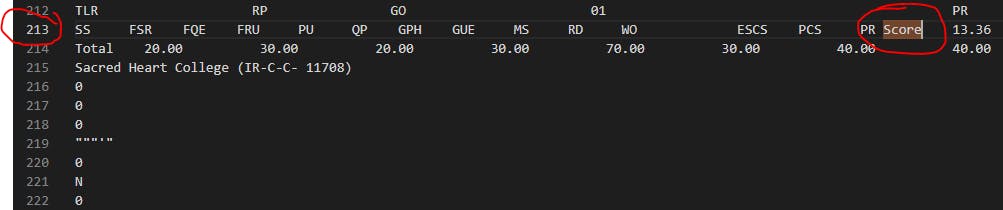
Knowing about data is the first step to working with it. It is imperative to first understand the data. Firstly, take a look at the data. The spreadsheet should contain the scores of each college.
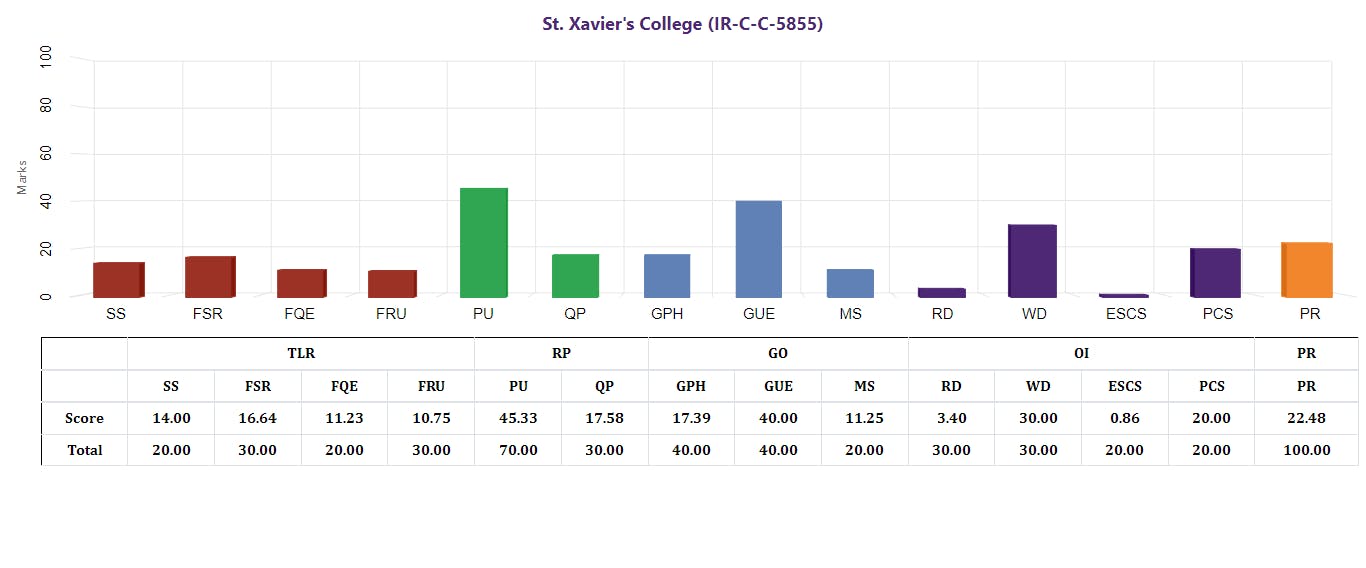
The data shows that the image contains text, so we can convert it into a text format to extract the text.
Step 1
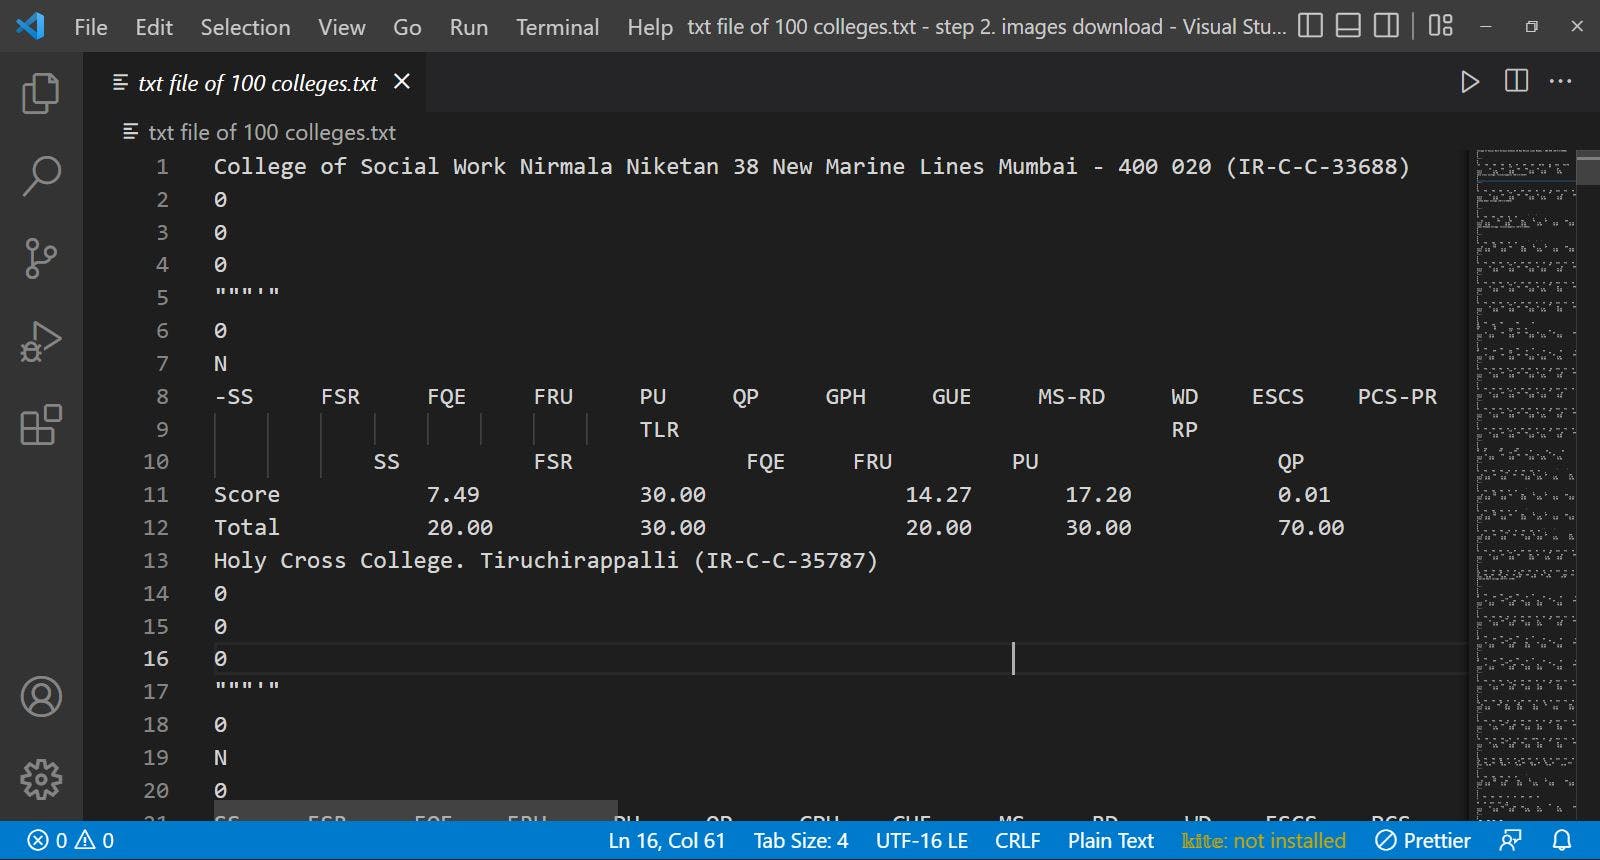
Let's try a method to convert the image into text and see what the results are. Website link: online2pdf.com/convert-png-to-txt#
 If we try to look at the data we can see that we can extract the score values from this text file. We can do this by writing Python code for file handling and converting it into a CSV file.
Step 2
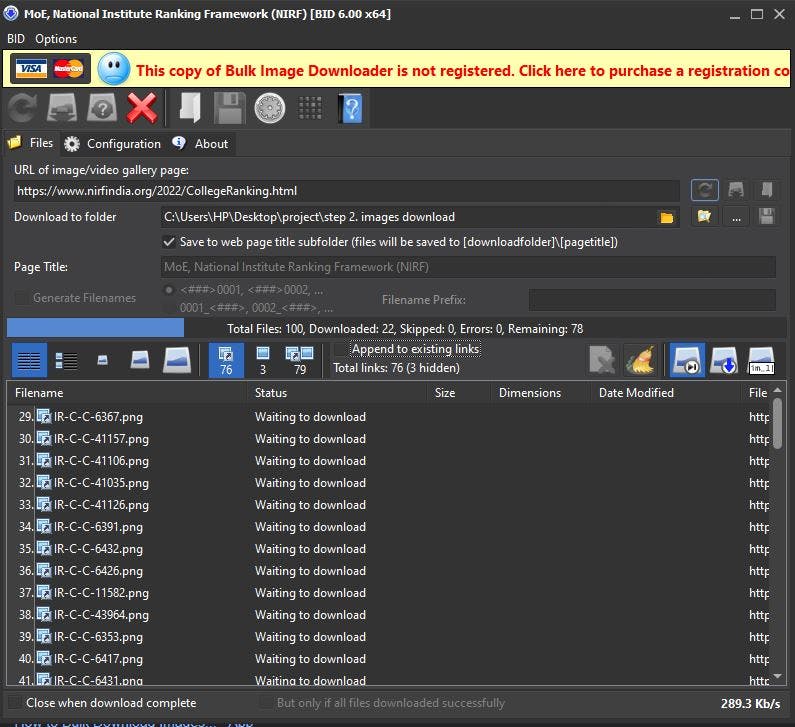
Using this method, we can extract data for a single image, but we need to extract data for 100 images using this method. To do this, we must first download all 100 images from the website and convert them into a single text file.
Step 2.1
To download all 100 images, we will use Bulk Image Downloader.
Step 2.2
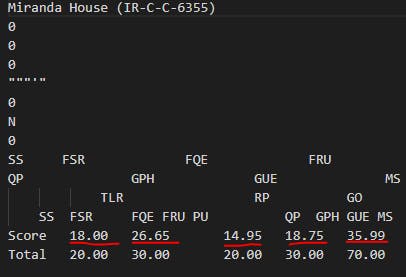
It is now time to convert the .png files to .txt files. Many websites can be used. Converting a file from one format to another reduces the quality of the text in my case, so I am converting .png to .txt directly in a set of 20 (the website allows converting in a set of 20 only).
As a result, we now have a single text file containing data from all colleges. Adding the data to a spreadsheet requires some cleaning
Data Cleaning
Understand your data
As we look at our data, it becomes apparent that many college names are missing. However, the scores for all 100 colleges are available. Additionally, there are some unwanted data. Thus, we need to clean the data so that we only have the scores in a CSV file. After that, we'll match the scores with the college using IMPORTHTML and VLOOKUP in Google Sheets, and validate the results as well
Step 3
Using Python, we will extract lines beginning with Score and common-spread their values. For backup purposes, we'll make a copy of the text file before running the Python code. To handle errors in the code, I have created versions of the code and the dataset to display all the errors in the file
Version 1
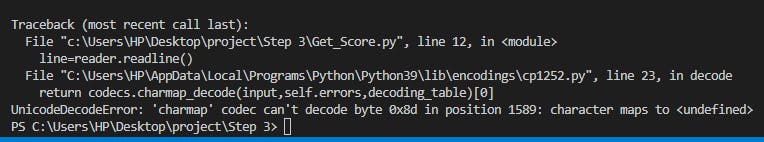
As a result of converting a PNG file to a text file, we may encounter some unwanted characters, so we will need to remove them.
Example:
Unwanted character
Error due to unwanted character
Version 2
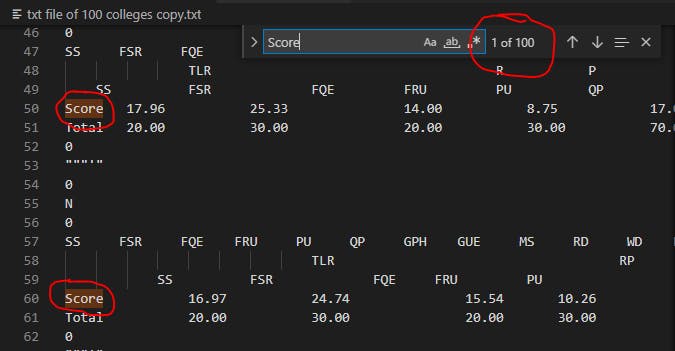
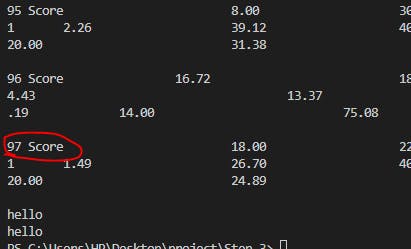
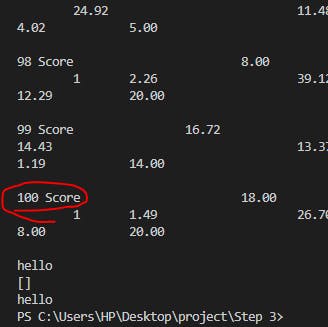
Version 2 of the code shows that only 97 lines are starting with Score, but the dataset contains 100 Score words, so we must find the remaining three lines.
100 Score words
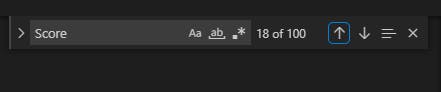 97 lines starts with the word Score
Version 3
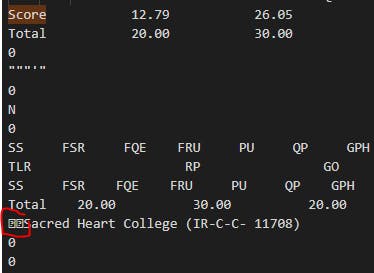
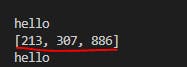
The three lines that don't start with a score have been identified.
Code to identify missing Score lines
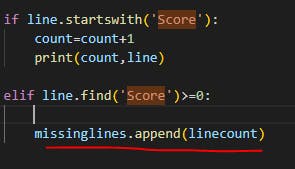
line number of the same
Here we find the problem
Version 4
In this version, we have removed all the errors from the previous versions. As a result, we have 100 Scores. I will add a new line to each of these three lines.
Version 5
Our next step will be to create a CSV file containing the score data.
count=0
linecount=1
ScoreLines=[]
with open("Colleges_dataset_V5",'r') as reader:
    line=reader.readline()
    print("hello1")

    while line != '':

        if line.startswith('Score'):
            count=count+1
            ScoreLines.append(line)

        line=reader.readline()
        linecount=linecount+1
    print('hello')

with open("College_csv.csv",'w') as writer:
    for line in ScoreLines:
        new_college=""
        x=-1 #to store the start and end of sub string
        for i in range(6,len(line)):# first characters in each line is Score We do not need that
            if line[i-1].isspace() and line[1].isalpha():
                x=i

            elif line[i].isspace():
                if x!=-1:
                    new_college=new_college+line[x:i]+','
                x=-1

        new_college=new_college[0:len(new_college)-1]#remove the last ','
        print(new_college)
        writer.write(new_college+"\n")


print("hello")
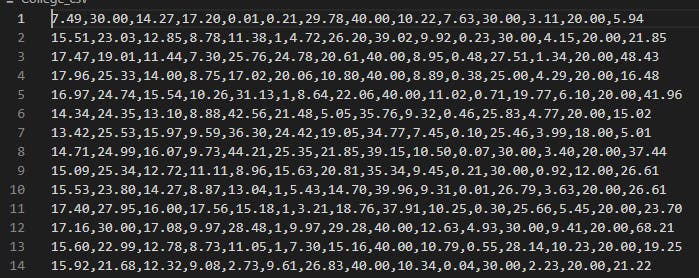
Output
Step 4
As a result, we have a CSV file of the dataset College_csv. The next step is to create a spreadsheet and detect any errors in the data.
Our data has 14 columns for each college, but when we convert it into a spreadsheet, we see that some colleges have 15 columns. We need to clean up this data now. Dirty data in spreadsheet
Step 4.1
Try to figure out the error using some rows with dirty data. Take a look at the 98th row in the table.
8,30,19.63,19.71,15.14,1,2.26,39.12,40,20,13.7,0,12.29,20,31.38
Check the value with the 98th data, which is the 3rd last image of part 5 (p5)
In this case, 12.26 is the sixth value, not 1
Step 4.2
Apply conditional formatting to column F (6th column) where the value is 1. These rows have 15 columns in the data, as we can see. Therefore, we must change our program so that the 6th value is not equal to one
Note: Before using conditional formatting, ensure that any row contains a value equal to 1 and has 14 columns. For this case, all rows with a value of 1 have 15 columns.
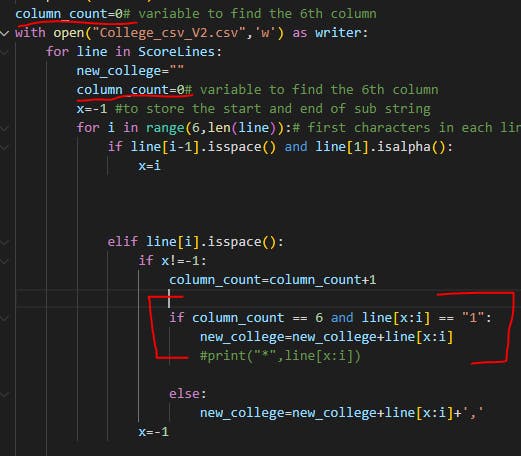
Version 6
A condition has been added so that the value in the 6th column cannot be 1. Now we have a spreadsheet that has 100 rows and 14 columns for each value. Clean Data
Code to clean data
Data Validation
We now have a spreadsheet file containing the dataset. As a next step, we will validate our results.
Understand your data
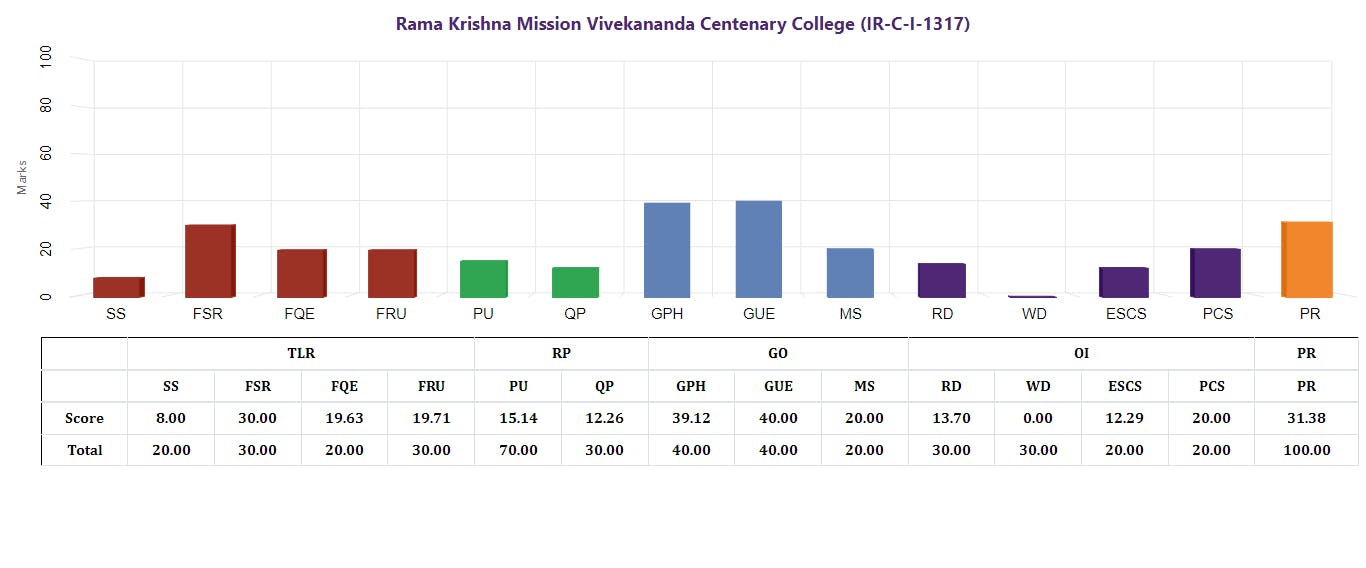
Here are the values that we have stood for:
SS FSR FQE FRU PU QP GPH GUE MS RD WD ESCS PCS PR
We can find here details about the same: nirfindia.org/nirfpdfcdn/2021/framework/Col..
It is now time to validate this data. According to the NIRF website, these values are used to calculate a college's score. By using IMPORTHTML, we can retrieve the scores of the college. In other words, we will calculate the Scores from the above values and validate them with the actual Scores.
Step 5
Calculation of the Score :
TLR = SS + FSR + FQE + FRU
RP = PU    + QP
GO = GPH + GUE + MS
OI = RD    + WD + ESCS + PCS + OI
SCORE = 0.40*TLR + 0.15*RP + 0.25*GO + 0.10*O1 + 0.10*PR
Spreadsheet after Calculation: docs.google.com/spreadsheets/d/1vlLNEewZVC-..J6aCcF6DYovXVMYdFO6UK-o/edit?usp=sharing
Step 6
Now we will sort our dataset based on the scores in the dataset and import the actual scores using IMPORTHTML.
Import data

=IMPORTHTML("https://www.nirfindia.org/2022/CollegeRanking.html","table",1)

Calculating the Score

=SUM(E2*0.4,H2*0.15,L2*0.25,Q2*0.1,R2*0.1)

Round up of values

=ROUNDUP(S2,2)
Spreadsheet after Calculations: docs.google.com/spreadsheets/d/1bqnLBwHs7qG..
Step 7
To get the name and rank of the college from the imported data, we will use VLOCKUP. Based on the sorted dataset we have, we will also rank the college. To validate the results, we will compare both the imported rank and the allotted rank based on the sorted data.
Error in Version 5
The scores of the imported data and our dataset do not match in many places. A careful analysis shows that the imported data from the NIRF site contains a calculation error of the sum.
Example
- For Atma Ram Sanatan Dharm College Rank 7
GO = GPH + GUE + MS
      = 30.38+ 40 + 13.44
      =**83.82**
But the value given in the Website in 83.81.
- For Lady Irwin College Rank 16
TLR = SS + FSR + FQE + FRU
       = 9.91+30+18.74+22.51
       =**81.16**
But the value given in the Website in 81.15
Spreadsheet link : docs.google.com/spreadsheets/d/1oUnBAAUWs79..
Step 8
As a result, we cannot say that the value was rounded up, rounded down, or simply rounded off. I have emailed NIRF asking for a guide on the issue. As a result, I am using VLOOKUP to compare the rank values (allotted and imported) and then find the difference in score values. It will be flagged if there is a major difference between the two scores
To use VLOCKUP, we must shift the rank to the left side of the imported data.
=VLOOKUP(U2,'Imported Data'!A1:F101,6)
We can say that the data is validated since there is a maximum difference of 0.02.
docs.google.com/spreadsheets/d/1GliyrgAr2_y..
Step 9
The college name will now be added and formatted to make sure it is clearly understood
Adding the name of the college
=VLOOKUP(A2,'Imported Data'!A1:F101,3)
Stay tuned for more interesting articles. Thank you so much.